In this project, I explore differential gene expression and pathway enrichment in two prostate cancer cell lines—LNCaP and PC3—under different oxygen conditions: hypoxia (low oxygen) and normoxia (normal oxygen). Hypoxia is a common feature of tumor environments and can drive cancer progression and treatment resistance, so understanding the genetic response to hypoxia is important in cancer research. Through this project, I applied bioinformatics techniques to analyze RNA sequencing (RNA-seq) data, identified differentially expressed genes (DEGs), and performed pathway enrichment to reveal biological processes involved in the hypoxic response.
Project Overview
This analysis focuses on comparing the expression profiles of LNCaP and PC3 cells under hypoxic and normoxic conditions. By investigating these two cell lines, I aimed to understand the unique and shared genetic responses in prostate cancer to varying oxygen levels. I conducted this analysis using the DESeq2 package in R for differential gene expression and clusterProfiler for pathway enrichment analysis.
Main Objectives:
1. Identify genes that are significantly up- or down-regulated under hypoxia.
2. Highlight pathways that are enriched in the hypoxic conditions in each cell line.
3. Develop data visualization skills to present and interpret complex biological data.
Data Description
To carry out this analysis, I used two main files:
1. Raw Counts Data (raw_counts.csv): This file contains raw read counts from RNA-seq data, where each row corresponds to a gene (identified by Ensembl ID), and each column represents a sample.
2. Gene Annotation (GRCh38.p13_annotation.csv): This file provides information about each gene, such as its Ensembl ID and gene name, which helps in identifying genes in the expression data.
Data Structure:
• Raw Counts File: The first column should contain Ensembl gene IDs, and the remaining columns contain counts for each sample.
• Annotation File: This file must have at least two columns, “Gene.stable.ID” (Ensembl ID) and “Gene.name” (gene name), to map the gene expression data.
Analysis Pipeline
My analysis pipeline consisted of the following steps:
1. Data Preparation
First, I loaded the raw count data and gene annotation file into R. I ensured the raw count data was formatted correctly by setting Ensembl IDs as row names and sorting sample columns according to the experimental conditions.
2. Differential Expression Analysis with DESeq2
The core of the analysis was conducted using DESeq2. I created a DESeqDataSet object with the count data and a condition variable representing each sample’s experimental group (e.g., LNCaP Hypoxia, LNCaP Normoxia, PC3 Hypoxia, and PC3 Normoxia). Using DESeq2, I performed differential expression analysis to identify genes that were significantly up- or down-regulated under hypoxic conditions.
3. Visualization
Visualization is crucial in understanding complex data. Here, I created various plots to explore and present the results.
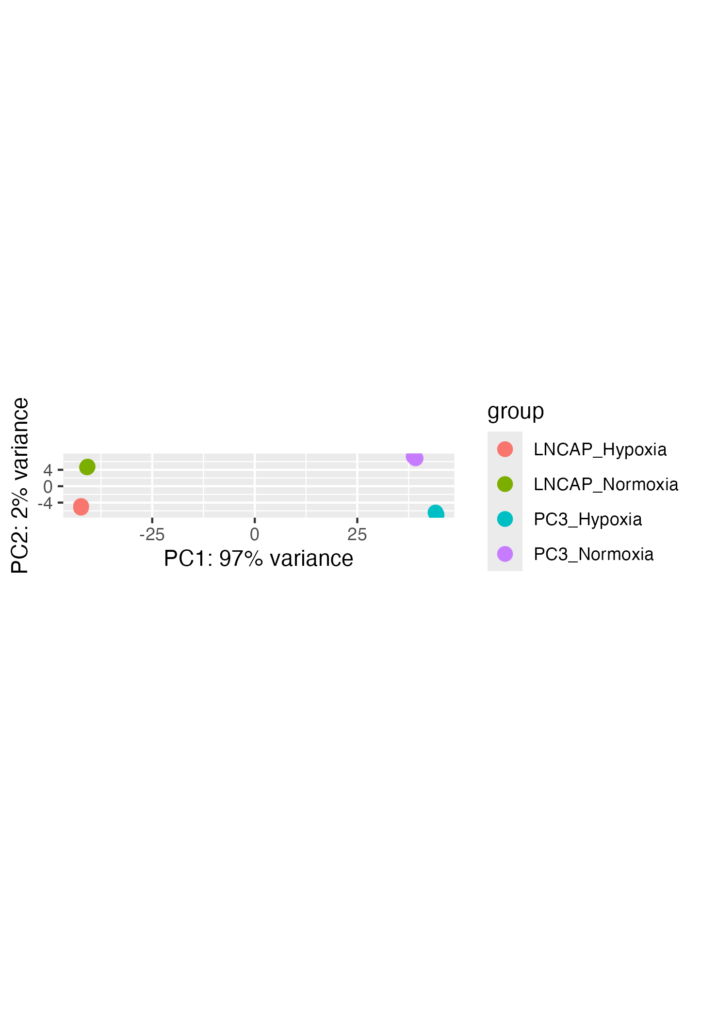
PCA Plot: I used Principal Component Analysis (PCA) to check if samples clustered according to their conditions. The PCA plot provided insights into how similar or different samples are in terms of gene expression.

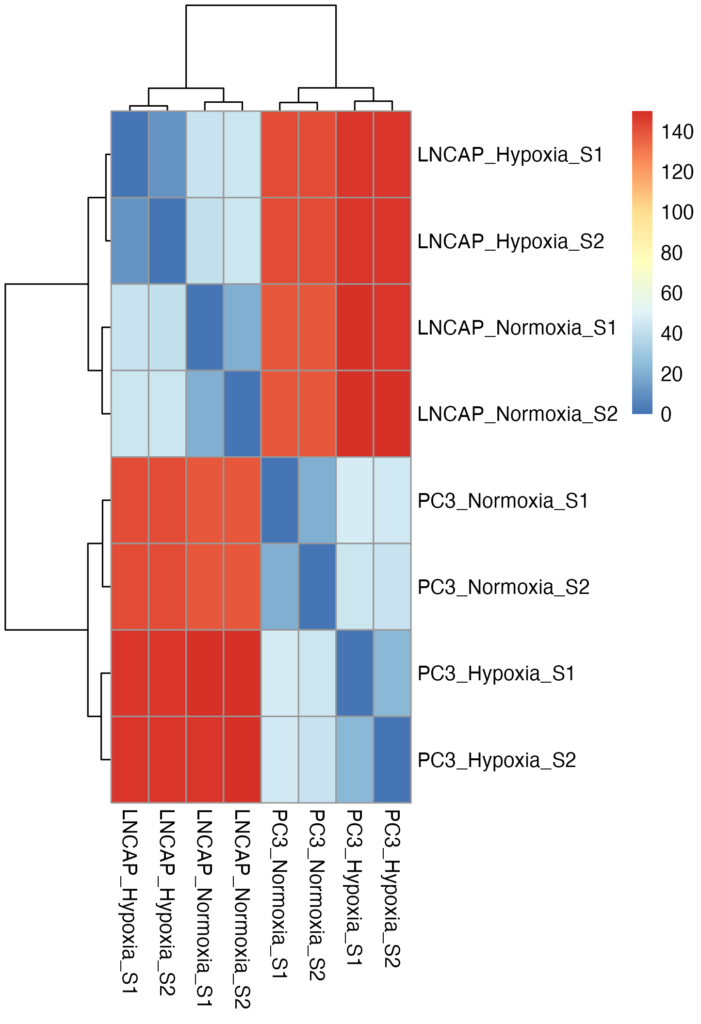
Heatmap: This plot shows the distances between samples, highlighting how each sample relates to others within or across groups.

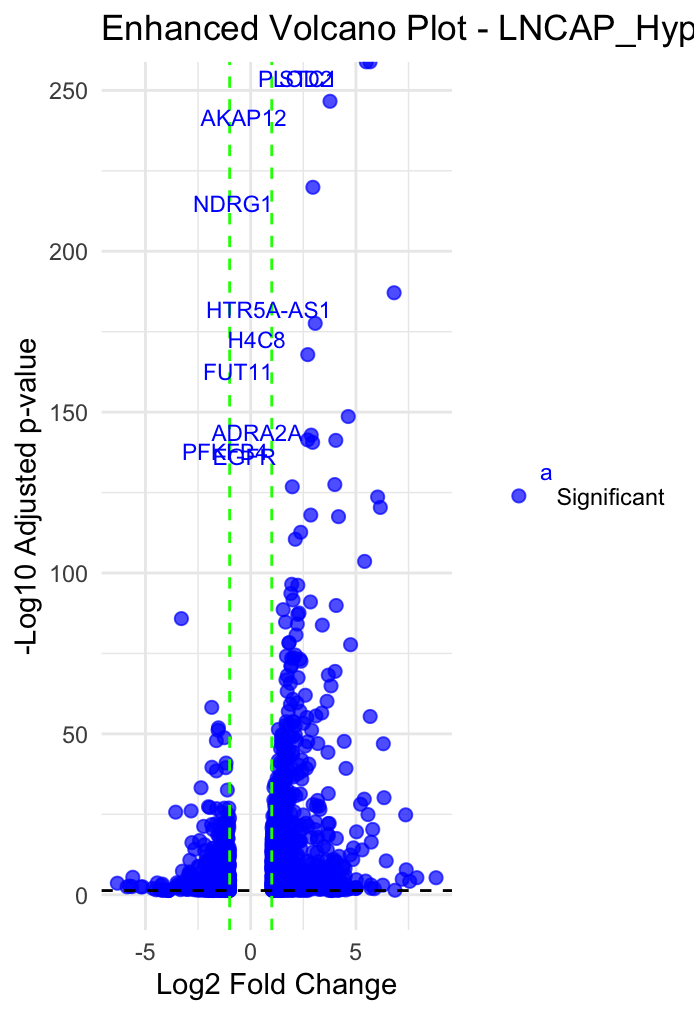
Volcano Plot: I generated volcano plots to visualize DEGs, with the x-axis showing the log2 fold changes and the y-axis displaying the -log10 adjusted p-values. Genes that are highly up- or down-regulated appear at the edges of the plot, providing a clear picture of the most significant expression changes.

Pathway Enrichment Analysis with clusterProfiler
Next, I performed Gene Ontology (GO) enrichment analysis to find biological processes enriched among DEGs. Using the clusterProfiler package, I analyzed GO terms related to Biological Processes (BP), focusing on pathways that are relevant to cancer under hypoxia.

Results
After processing the RNA-seq data, I obtained lists of DEGs for each comparison (e.g., LNCaP Hypoxia vs. Normoxia). The lists were filtered by statistical significance to focus on genes with strong changes in expression. Each list of DEGs was then used in pathway enrichment analysis, where I identified several key pathways that might be activated in response to hypoxia in prostate cancer.
The visualization outputs provided valuable insights:
• PCA Plot: Samples clustered by condition, indicating distinct expression profiles under hypoxia and normoxia.
• Heatmap: Clear separations between sample groups suggested that hypoxia induced significant changes in gene expression patterns.
• Volcano Plot: This plot highlighted a subset of genes with extreme expression changes, many of which are known to be involved in hypoxia responses.
Example Findings
Some of the enriched pathways included responses to oxidative stress and regulation of cellular metabolic processes, both of which are associated with adaptation to low oxygen environments. These pathways are often upregulated in tumors to support survival and proliferation under hypoxic conditions.
Conclusion
This project helped me develop a deeper understanding of gene expression analysis and pathway enrichment techniques. By applying bioinformatics tools like DESeq2 and clusterProfiler, I was able to investigate complex biological questions, analyze large datasets, and extract meaningful insights from the data.
Understanding how prostate cancer cells adapt to hypoxic conditions could contribute to future research on therapeutic targets, potentially aiding in the development of treatments that disrupt the tumor’s ability to thrive in low-oxygen environments.
This analysis also allowed me to refine my skills in R programming, data visualization, and biological interpretation of high-throughput sequencing data.
