
Data Analysis on the prevalence of Anemia and its factors in Pregnant and Non Pregnant Women.
Abstract
Anemia is a common health issue that disproportionately affects women. Because pregnant women require more iron, the consequences of anemia are more severe. This study uses data from the World Health Organization (WHO) to conduct a thorough statistical analysis of anemia that differentiates between pregnant and non-pregnant women. We examine the relationship between hemoglobin concentration distribution and anemia status using box plots, confusion matrices, and histograms. This research illustrates the difficulties in accurately diagnosing anemia due to the minor variations in hemoglobin levels. The dataset includes the prevalence of anemia in women between the ages of 15 and 49 in different parts of the world between 2010 and 2019, with a distinction made between pregnant and non-pregnant groups.
Introduction
Anemia has been recognized as the most common form of nutritional deficiency worldwide, particularly in developing countries. Though anemia is easily treatable and preventable disease, it continues to be significantly associated with pregnancy. Diminished intake and increased demand, excess demand in case of pregnant woman and altered metabolism along with the background characteristics like low socioeconomic status, illiteracy, early age of marriage associated with increase in susceptibility to infectious diseases like hookworm infestations may serve to be the underlying factors associated with prevalence of anemia during pregnancy. According to the World Health Organization (WHO) prevalence of anemia among pregnant women varies from 14% in developed countries to 65%–75% in developing countries[1].
Anemia in women may end up being the root cause of both perinatal and maternal death[2]. The WHO classifies anemia in pregnancy as having a hemoglobin value of less than 11 g/dL[3]. Pregnant women with hemoglobin levels between 10.0 and 10.9 g/dL, 7 and 9.9 g/dL, and severe <7 g/dL can be further classified as having mild, moderate, or severe anemia[4]. Many studies have showed a link between anemia and the death rate among mothers.
Pregnancy-related anemia can cause low birth weight, stillbirth, neonatal death, and intrauterine growth retardation in in addition to maternal mortality. Thus Anemia is associated with a number of intricate and multivariate risk factors, especially during pregnancy. The key to preventing anemia and its possible effects is raising people’s awareness of these risk factors and encouraging them to follow preventative guidelines[5,6].
Data Sources
Methods
The methodology used to analyze anemia in women combines sophisticated statistical techniques with Python and its modules (NumPy, pandas, matplotlib, seaborn, and Scikit-learn). First, pandas is used to organize and clean the dataset, which serves as the foundation for exploratory research. Important actions consist of: Data Organization: Data cleansing and structure are accomplished with pandas.
Experimental Analysis
Using matplotlib, divide data according to anemia status and produce histograms to compare hemoglobin distributions. This aids in comprehending the variations and trends in hemoglobin levels amongst various populations.
Algorithm Quality Evaluation: By creating a heatmap for the confusion matrix using logistic regression using Seaborn, one may evaluate how well the prediction model is at categorizing anemia.
Visualization of Hypothesis Testing
Using Seaborn’s boxplot features, analyze hemoglobin levels across several groups, emphasizing medians, interquartile ranges, and distribution.
Further Statistical Analysis
Utilizing scikit-learn for Python linear regression modeling and linear regression to investigate the association between anemia prevalence in pregnant and non-pregnant women.
Correlation Analysis
Using pandas to compute and visualize a correlation matrix, which is then shown using Seaborn as a pheatmap.
Results
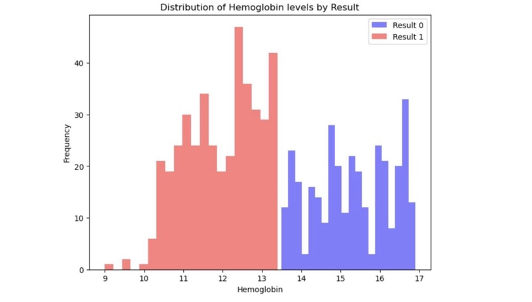
Non-anaemic individuals tend to have higher hemoglobin concentrations, with the most frequent levels centered around 13 to 14 g/dL, suggesting robust hemoglobin presence typical of a healthy population. The anemic group’s hemoglobin distribution skews lower, peaking between 11 and 12 g/dL, indicative of the reduced hemoglobin levels that characterize anemia. Notably, there’s an overlap in the 12 to 13 g/dL range, showing a diagnostic gray area where individuals could potentially be misclassified.
The histogram also reveals that non-anemic individuals have a higher frequency of occurrence within the normative range, whereas anemic individuals are less frequently represented across all levels, possibly reflecting a lower prevalence or sample size variability. These distributions underscore the importance of understanding hemoglobin dynamics for medical diagnostics and highlight the need for a nuanced approach to anemia classification.
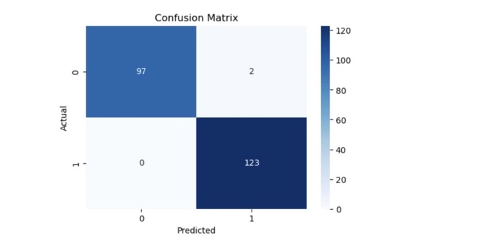
The above confusion matrix presented above demonstrates a classification model with a remarkable predictive accuracy in distinguishing between anemic and non-anemic individuals. With 97 true negatives and 123 true positives, the model correctly identified the majority of cases, while only misclassifying two instances as false positives and none as false negatives. This indicates an exceptionally high sensitivity, ensuring that nearly all anemic cases are detected, and high precision, with very few non-anemic cases being incorrectly labelled as anemic. The overall accuracy is impressive, with 220 correct predictions out of 222.
While the absence of false negatives is notable, it raises a question about the potential for overfitting, suggesting that the model may be too finely tuned to the specific data it was trained on, which could affect its performance on unseen data. For a robust evaluation, further validation across diverse datasets would be essential to ensure that the model maintains its high level of accuracy in different contexts and to rule out the chance of overfitting. The results, as they stand, endorse the model’s reliability for clinical or diagnostic use in identifying anemia, provided that its performance is consistent across various populations and settings.
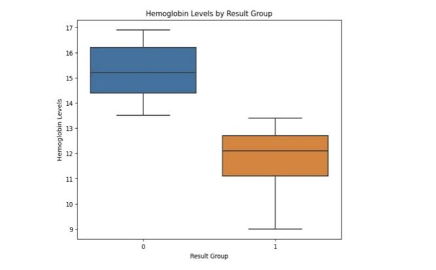
The above box plot provides a detailed comparison of hemoglobin levels between two anemic and non- anemic groups. The non-anemic group demonstrates a higher median hemoglobin level, reflecting the normative range expected in a healthy population, and exhibits a broader interquartile range, suggesting a greater diversity in hemoglobin levels among this cohort. Anemic group median is notably lower, aligning with the medical condition of anemia, which is characterized by reduced hemoglobin.
Despite the clear median separation, the interquartile ranges of both groups overlap, revealing that a subset of individuals’ hemoglobin levels straddles the boundary between anemic and non-anemic classifications. This indicates potential challenges in diagnosing anemia based solely on hemoglobin levels, as individuals with levels within this overlapping zone might not be distinctly categorized without considering additional clinical factors. The absence of outliers points to a consistent pattern within each group, but the distinct non-overlapping range of values (the whiskers) between the two groups accentuates the overall difference in hemoglobin concentrations typically associated with anemia. This visualization highlights the nuanced nature of hemoglobin level distributions and suggests a need for multifaceted diagnostic criteria, particularly for those whose hemoglobin levels fall within the overlapping middle ranges.
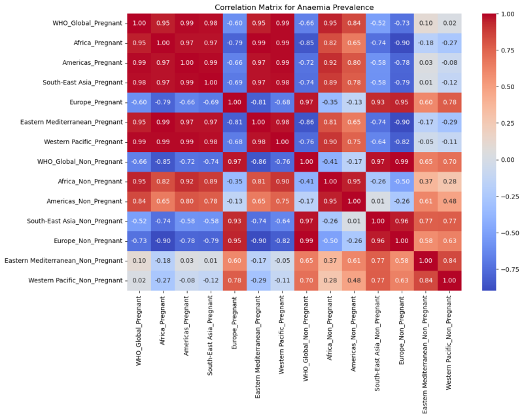
Pregnant women’s anemia prevalence has a strong positive association with the other regions, suggesting that they rise and decline simultaneously. Anaemia prevalence in non-pregnant women also shows a positive correlation across areas. Examining the two groups (pregnancy vs. non-pregnant), strong positive and negative relationships are noticed.
For example, there is a significant negative connection between WHO_Global_Pregnant and WHO_Global_Non_Pregnant, suggesting that a rise in anemia prevalence among pregnant women internationally likely to be accompanied by a drop in non-pregnant women, or vice versa. The links in anaemia prevalence changes between the two categories within the same areas are not consistently positive or negative, as seen by the correlations between pregnant and non-pregnant groups within the same region (Africa_Pregnant vs. Africa_Non_Pregnant, for example).
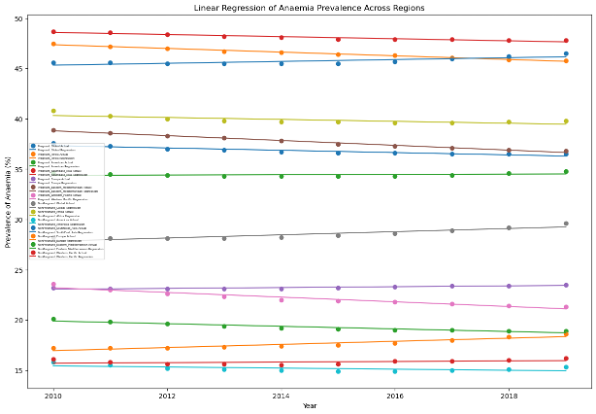
The above linear regression is to show the prevalence of anaemia in different countries among pregnant and non-pregnant women. The results of the regression analysis for the anemia prevalence among pregnant women from 2010 to 2019 show that the prevalence of anemia is generally declining worldwide, with the largest declines occurring in the Eastern Mediterranean and Africa. Europe, meanwhile, shows a minor increase.
The trends for women who are not pregnant are more diverse, showing mixed regional patterns and a modest rise in the incidence of anemia worldwide. The graphic plot highlights these results, with most locations exhibiting declining trends for expectant mothers in contrast to the unstable trends for non-pregnant women, which are indicative of various public health difficulties in treating anemia. Regression lines and real data points (dots) are used in the figure to illustrate these tendencies. Except for Europe, where there is a minor rise, most areas exhibit a declining trend in the frequency of anemia among pregnant women.
For Not Pregnant Women: Regional rates range from declining to growing, while the worldwide trend indicates a rise.
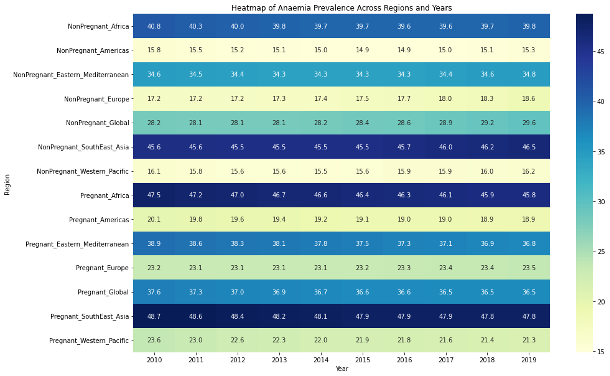
The above pheatmap from 2010 to 2019 showing the prevalence of anemia in pregnant and non-pregnant women in different areas.
For women who are not pregnant:
Africa In 2010, the frequency was 40.8%; by 2019, it had slightly increased to 39.8%. Americas: The prevalence rate is modest and comparatively consistent, beginning with 15.8% and gradually rising to 15.3%. South-East Asia: This region’s predominance is constantly high, beginning at 45.6% and dipping slightly to 45.5%.
For expectant mothers:
Africa: The continent’s prevalence rate begins at 47.5%, the highest, and falls to 45.8%. Americas: It has the lowest prevalence rates of any area, with a beginning rate of 20.1% and a subsequent decline to 18.9%. South-East Asia: Maintains the highest rates among the regions, starting at 48.7% and showing little change over time.
Discussion
Pregnant Women Frequently Have Higher Anemia Prevalence: Pregnant women frequently have higher anemia prevalence, particularly in South-East Asia, which emphasizes the higher iron requirements during pregnancy. This emphasizes the necessity of targeted public health initiatives in these areas.
Regional Variability: The prevalence of anemia varies significantly between locations. The Americas have the lowest rates, despite South-East Asia and Africa having the highest rates. This suggests that different epidemiological trends call for different approaches depending on the location.
Diagnostic Difficulties: The difficulty in identifying anemia is indicated by an overlap in levels of hemoglobin between persons who are anemic and those who are not. This calls for more complex diagnostic standards, maybe incorporating clinical variables other than hemoglobin concentrations.
Public Health Implications: Considering the multiple and complicated nature of anemia risk factors, our findings emphasize the significance of focused health interventions. They also draw attention to that how important it is to keep an eye on anemia and modify public health initiatives as needed, particularly in high-risk areas and demographics.
References
1.Demayer EM, Tegman A. Prevalence of anemia in the world World Health Organ Qlty. 1998;38:302–18
2. Ezzati M, Lopez AD, Rodgers A, Hoorn SV, Murray CJ. Selected major risk factors and global and regional burden of disease Lancet. 2002; 360:1347–60
3. Breyman C. Current aspects of diagnosis and therapy of iron deficiency anemia in pregnancy Schweiz Rundsch Med Prax. 2001; 90:1281–93
4. De Benoist B, McLean E, Egli I, Cogswell M Worldwide Prevalence of Anaemia 1993-2005: WHO Global Database on Anaemia. 2008 Geneva World Health Organization
5. Axemo P, Liljestrand J, Bergstrom S, Gebre-Medhin M. Aetiology of late fetal death in Maputo Gynecol Obstet Invest. 1995;39:103–9
6. Brabin BJ, Premji Z, Verhoeff F. An analysis of anaemia and child mortality J Nutr. 2001;132:636S–48S
7.World Health Organization. (n.d.-b). Prevalence of anaemia in pregnant women (aged 15-49) (%). World Health Organization. https://www.who.int/data/gho/data/indicators/indicator-details/GHO/prevalence-of-anaemia-in-pregnant-women-(-)
8.World Health Organization. (n.d.-b). Prevalence of anaemia in non-pregnant women (aged 15-49) (%). World Health Organization. https://www.who.int/data/gho/data/indicators/indicator-details/GHO/anaemia-in-non-pregnant-women-prevalence-(-)
9.Rao, B. R. (2022, September 7). Anemia dataset. Kaggle. https://www.kaggle.com/datasets/biswaranjanrao/anemia-dataset.