
Abstract
Hypoxia, a condition of reduced oxygen, drives significant changes in prostate cancer progression. This study analyzes the impact of hypoxia on gene expression in two prostate cancer cell lines, LNCaP (androgen-sensitive) and PC3 (androgen-independent), using RNA-Seq.
We identified Differentially Expressed Genes (DEGs) and enriched pathways under hypoxic conditions. Results revealed a metabolic shift, with upregulation of glycolytic pathways and downregulation of oxidative phosphorylation, alongside cell-line-specific responses. These findings highlight potential biomarkers and therapeutic targets for prostate cancer treatment.
Background
Prostate cancer is one of the most common malignancies in men and a leading cause of cancer-related mortality worldwide. The progression of prostate cancer is influenced by various factors, including the tumor microenvironment. One of the critical conditions in this environment is hypoxia, a state of low oxygen availability, which significantly alters cellular behavior. Under hypoxic conditions, cancer cells undergo changes in gene expression and cellular pathways to adapt, survive, and proliferate.
This study focuses on two well-established prostate cancer cell lines, LNCaP and PC3, which represent distinct stages of prostate cancer. The LNCaP cell line is androgen-sensitive and represents a less aggressive form of prostate cancer, while the PC3 cell line is androgen-independent and highly aggressive. By understanding how these two cell lines respond to hypoxia at the molecular level, we can identify changes that are critical for cancer progression. Exploring these changes can provide valuable insights into potential biomarkers for disease progression and highlight pathways that can be targeted for therapeutic intervention.
Objective
The objective of this study is to investigate the effects of hypoxia on gene expression in prostate cancer cells using RNA-Seq analysis. The analysis aims to identify Differentially Expressed Genes (DEGs) between hypoxic and normoxic conditions and to determine the pathways enriched under hypoxia. By exploring these pathways, the study seeks to understand the cellular adaptation mechanisms that allow cancer cells to survive under low oxygen conditions. Additionally, the findings aim to identify potential biomarkers associated with hypoxia-driven cancer progression and uncover therapeutic targets that could be utilized in future treatments.
Dataset Description
This study focused on two prostate cancer cell lines, LNCaP and PC3, to examine the effects of hypoxia on gene expression. LNCaP is an androgen-sensitive, less aggressive cell line, while PC3 is androgen-independent and represents a more aggressive form of prostate cancer. The experimental design involved exposing both cell lines to two oxygen conditions: normoxia, representing normal oxygen levels, and hypoxia, simulating a low-oxygen tumor microenvironment.
The dataset used for the analysis was obtained from publicly available resources with GEO Accession GSE106305 and SRA Accession SRP122890. The dataset included a total of 8 samples, consisting of two biological replicates for each condition (normoxia and hypoxia) per cell line. Approximately 60,000 genes were annotated using the GRCh38 reference genome, providing a comprehensive dataset for differential expression and pathway analysis. The availability of biological replicates ensured the robustness of the findings and minimized potential biases.
Methodology
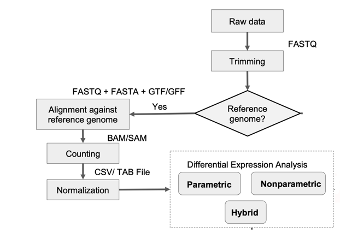
The analytical workflow commenced with RNA-Seq data processing, using several computational tools and software platforms. Quality control of raw sequencing data was performed using FastQC to ensure the data met high-quality standards. Trimmomatic was employed for read trimming, removing low-quality bases and adapter sequences. Reads were then aligned to the GRCh38 human reference genome using HISAT2, ensuring precise mapping of sequences to their genomic locations. Gene quantification was carried out with FeatureCounts, providing normalized expression values for downstream analysis.
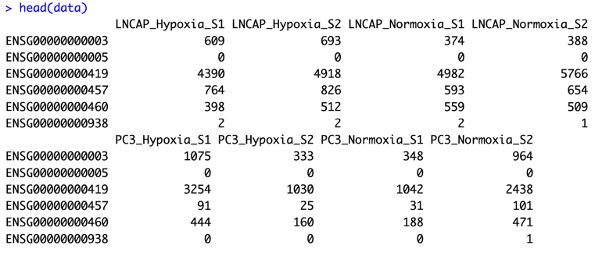
Data preprocessing was performed by quantifying gene expression levels and annotating them using the GRCh38 human genome reference. This step generated expression matrices that were used for downstream analyses.
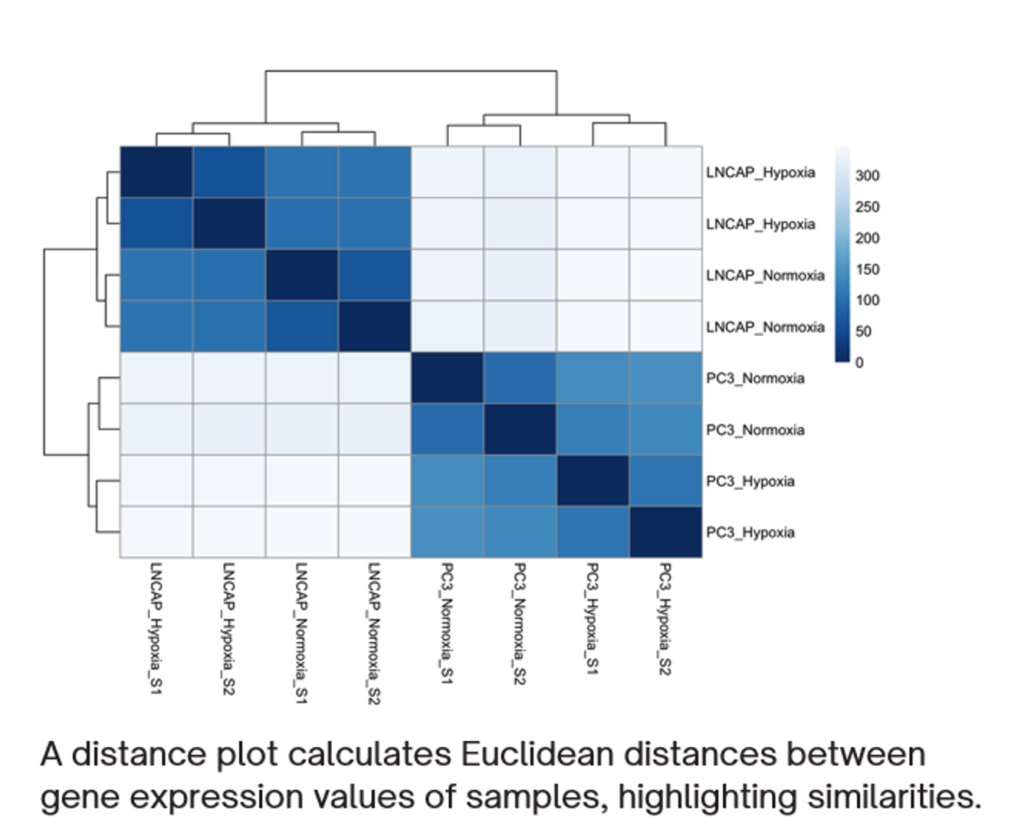
To assess sample variability, multiple quality control measures were applied. A distance plot was generated to compute pairwise Euclidean distances between samples, providing an overview of similarities and differences in gene expression. Additionally, a heatmap of the most variable genes was created to visualize clustering patterns among samples. Principal Component Analysis (PCA) was performed to explore the overall variability and groupings within the dataset, highlighting distinctions between normoxic and hypoxic conditions as well as between the two cell lines.
For the differential gene expression analysis, the DESeq2 pipeline was used to identify genes significantly altered under hypoxia. To capture cell-line-specific responses, the analysis was performed separately for LNCaP and PC3. DESeq2 generated lists of Differentially Expressed Genes (DEGs), which were further filtered based on statistical significance (adjusted p-value) and fold change values.
To interpret the results, various visualization techniques were employed. Dot plots and box plots were used to illustrate significant DEGs, showing the magnitude of changes and their statistical significance. A LogFoldChange comparison plot was generated to compare gene expression patterns between LNCaP and PC3 under hypoxia, revealing shared and unique responses between the two cell lines.
Pathway enrichment analyses were conducted using multiple databases and tools. KEGG Mapper was employed to explore metabolic pathways, while ClusterProfiler, integrated with R, provided insights into Gene Ontology (GO) biological processes. ReactomePA was utilized for Reactome pathway enrichment, highlighting translational and metabolic adaptations.
By analyzing LNCaP and PC3 data independently, we accounted for cell line-specific differences, ensuring precision in identifying hypoxia-responsive genes and pathways. A stringent significance threshold (adjusted p-value < 0.0005) was applied to identify differentially expressed genes, with additional focus on log2 fold changes to pinpoint key regulatory shifts.
Results
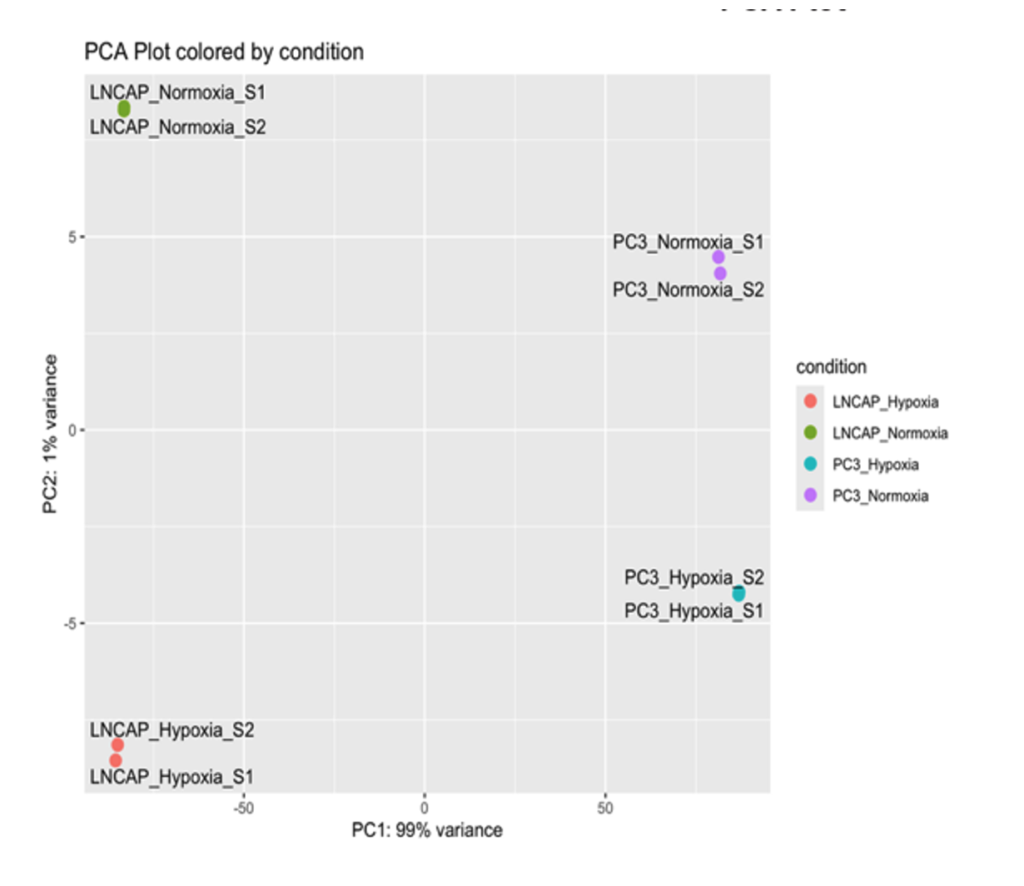
Sample Variability Analysis: To assess the consistency and variability of gene expression data, distance plots, heatmaps, and Principal Component Analysis (PCA) were used. The distance plot revealed clustering of samples based on similarities in gene expression profiles, indicating a clear separation between the two prostate cancer cell lines, LNCaP and PC3, and their respective oxygen conditions (normoxia and hypoxia). Similarly, the heatmap of the most variable genes demonstrated distinct grouping patterns, with samples clustering according to cell line and oxygen conditions. The PCA plot further highlighted this separation, showing that LNCaP and PC3 are distinct along the first principal component, which explained the majority of the variance (99%). Within each cell line, hypoxia induced subtle yet distinct variability in gene expression, indicating a clear effect of reduced oxygen on gene regulation.
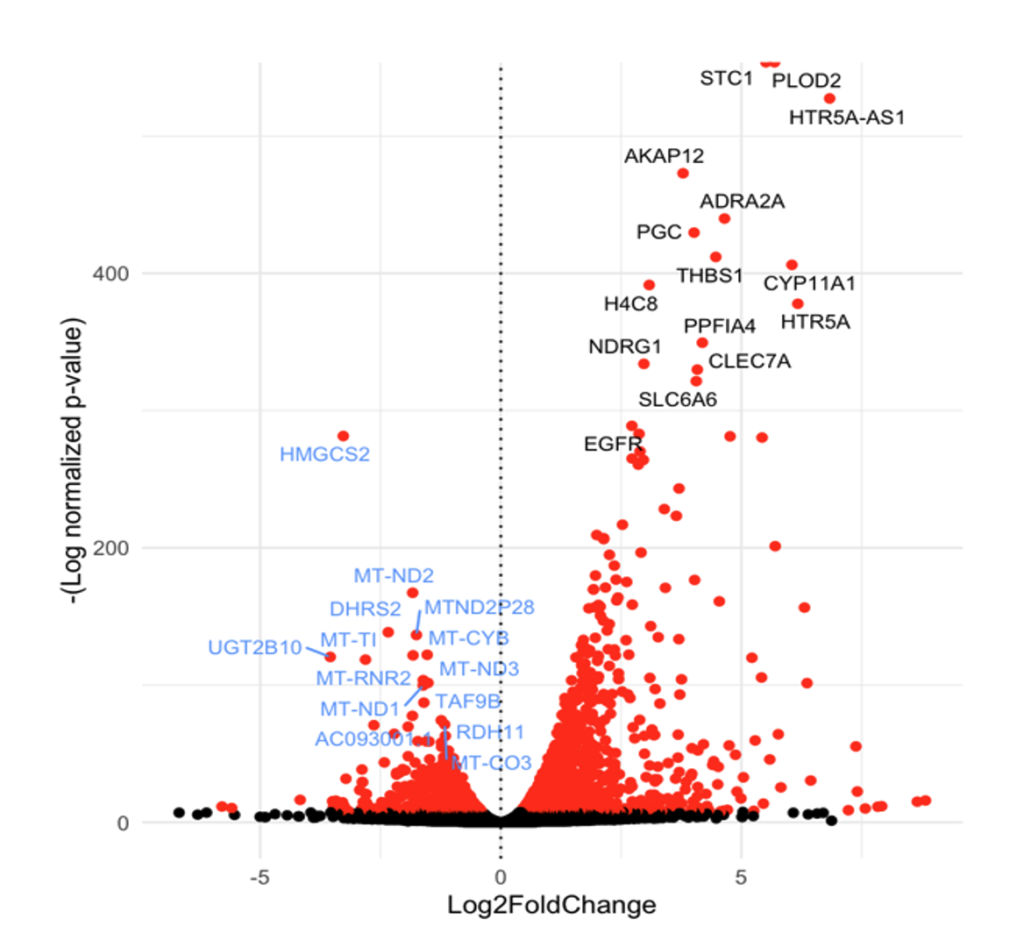
Differential Gene Expression Analysis: Differential gene expression analysis, performed separately for LNCaP and PC3 using DESeq2, revealed significant changes in gene expression under hypoxic conditions. The volcano plots illustrated the distribution of differentially expressed genes (DEGs), where upregulated and downregulated genes were identified with statistical significance. A key observation was the upregulation of genes involved in glycolysis and the downregulation of genes associated with oxidative phosphorylation, indicating a hypoxia-induced metabolic shift. While both cell lines showed similar trends, the magnitude and specific genes involved varied, reflecting cell-line-specific responses to hypoxia. The LogFoldChange comparison further demonstrated that some DEGs were shared between the two cell lines, whereas others were unique to either LNCaP or PC3, emphasizing the heterogeneity in hypoxic adaptation mechanisms.

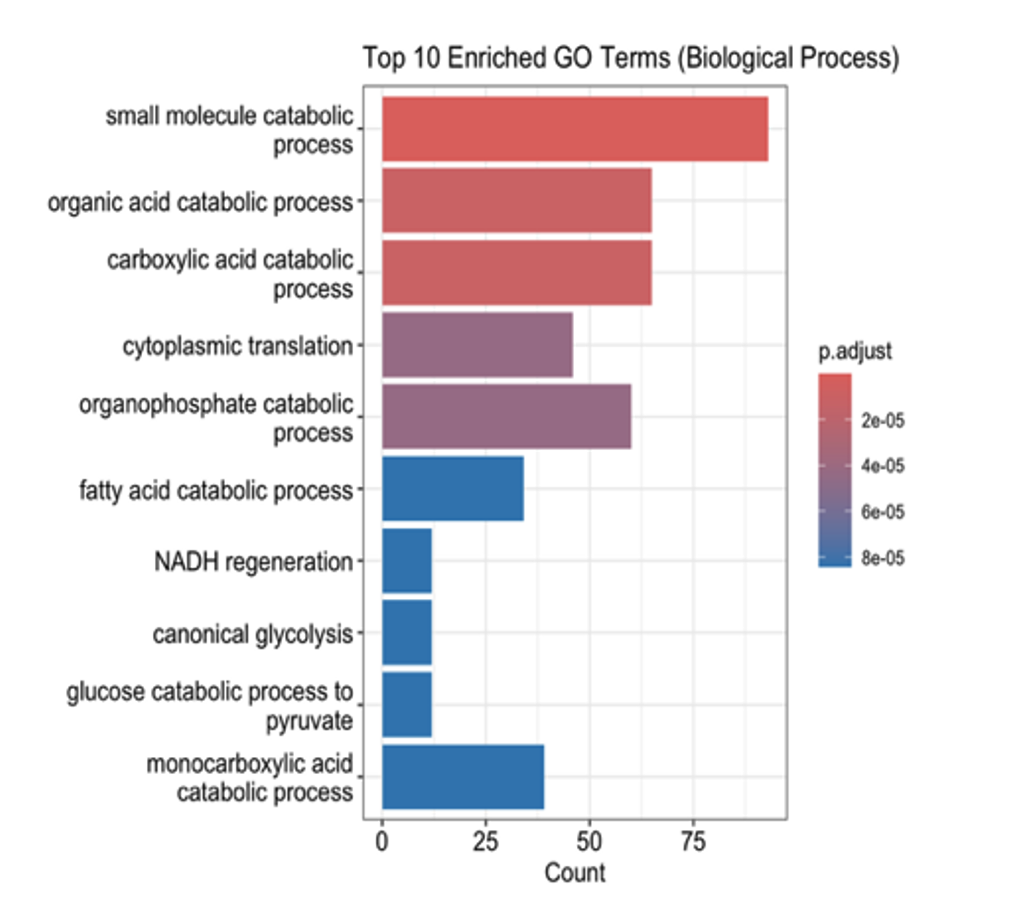
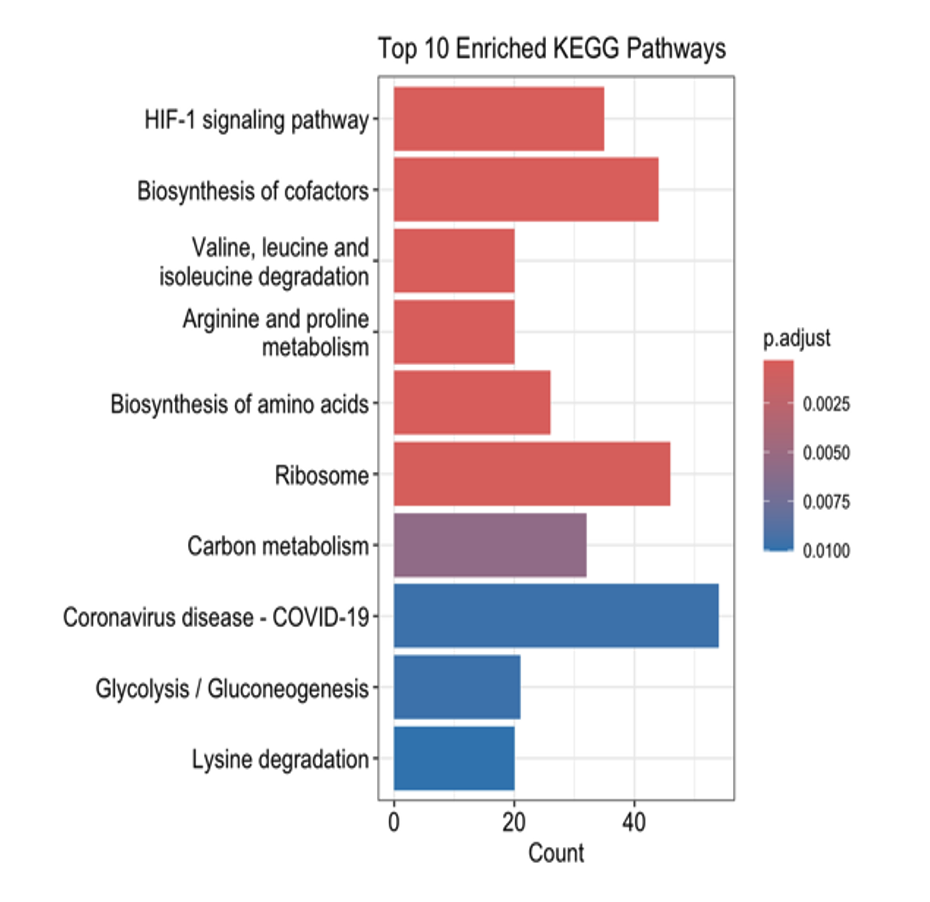
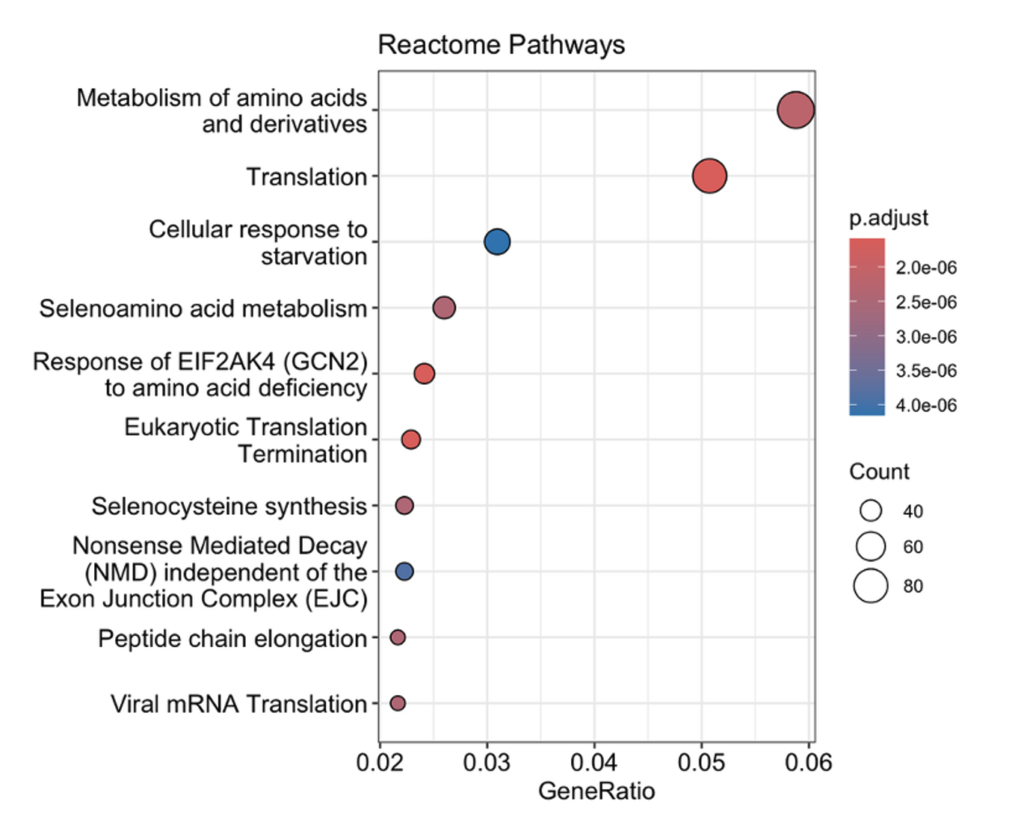
Pathway Enrichment Analysis: Pathway enrichment analysis provided deeper insights into the biological processes affected by hypoxia. KEGG pathway analysis revealed a significant upregulation of glycolytic pathways and a concurrent downregulation of oxidative phosphorylation, supporting the observation of a hypoxia-driven metabolic switch. Gene Ontology (GO) enrichment analysis highlighted processes associated with cellular adaptation, including translation regulation, energy metabolism, and cellular stress responses. Reactome pathway analysis further reinforced these findings, showing enrichment of pathways involved in translational control and metabolic adaptations, which are essential for cellular survival under hypoxic conditions.

Discussion
This study highlights the impact of hypoxia on gene expression and cellular pathways in prostate cancer cell lines LNCaP and PC3. Under hypoxic conditions, both cell lines exhibited a metabolic shift with upregulation of glycolytic pathways and downregulation of oxidative phosphorylation, consistent with the Warburg effect. Pathway enrichment analyses further revealed changes in processes like translation regulation and cellular stress responses, emphasizing the role of hypoxia in driving cellular adaptations for survival.
While both cell lines shared common hypoxia-responsive genes, significant differences in gene expression were observed. The aggressive PC3 cell line showed broader adaptations compared to LNCaP, reflecting its enhanced ability to cope with hypoxic stress. This underscores the heterogeneity of hypoxic responses in prostate cancer and the need for cell-line-specific therapeutic strategies.
Several challenges were encountered in this study. Despite clear findings, the analysis is limited to in vitro conditions, which may not fully represent the complexity of the tumor microenvironment in vivo. Additionally, hypoxia-induced changes may be influenced by other factors, such as tumor heterogeneity, signaling crosstalk, and genetic variability. The relatively small sample size also highlights the need for larger datasets to improve statistical power and generalizability.
Conclusion
This study explored the impact of hypoxia on gene expression and pathway alterations in prostate cancer cell lines LNCaP and PC3 using RNA-Seq analysis. Hypoxia induced significant changes in gene expression, including upregulation of glycolytic pathways and downregulation of oxidative phosphorylation, reflecting a metabolic shift to support survival in low-oxygen environments. These findings align with the Warburg effect, a hallmark of cancer metabolism. Pathway enrichment analyses further revealed adaptations in translation regulation and cellular stress responses, processes critical for tumor cell survival under hypoxic stress.
While both cell lines exhibited shared responses to hypoxia, distinct differences were noted, particularly in the aggressive PC3 cell line, which displayed broader gene expression changes. This underscores the heterogeneity of hypoxic adaptation mechanisms in prostate cancer and highlights the need for targeted, cell-line-specific therapeutic strategies. The identification of key biomarkers and enriched pathways provides a foundation for further research into therapeutic targets. Future studies using in vivo models and clinical validation are essential to confirm these findings and translate them into effective treatments for hypoxia-driven prostate cancer progression.
REFERENCES:
- Love MI, Huber W, Anders S. (2014). Moderated estimation of fold change and dispersion for RNA-seq data with DESeq2. Genome Biology, 15(12), 550.
- Kanehisa M, Goto S. (2000). KEGG: Kyoto Encyclopedia of Genes and Genomes. Nucleic Acids Research, 28(1), 27-30.
- Fabregat A, Sidiropoulos K, Garapati P, et al. (2018). The Reactome Pathway Knowledgebase. Nucleic Acids Research, 46(D1), D649-D655.
- Robinson MD, McCarthy DJ, Smyth GK. (2010). edgeR: a Bioconductor package for differential expression analysis of digital gene expression data. Bioinformatics, 26(1), 139-140.
- Pertea M, Kim D, Pertea GM, Leek JT, Salzberg SL. (2016). Transcript-level expression analysis of RNA-seq experiments with HISAT, StringTie, and Ballgown. Nature Protocols, 11(9), 1650-1667.
- Semenza GL. (2012). Hypoxia-inducible factors in physiology and medicine. Cell, 148(3), 399-408.
- Gilkes DM, Semenza GL. (2013). Role of hypoxia-inducible factors in breast cancer metastasis. Future Oncology, 9(11), 1623-1636.
- Gilkes DM, Semenza GL, Wirtz D. (2014). Hypoxia and the extracellular matrix: drivers of tumour metastasis. Nature Reviews Cancer, 14(6), 430-439.
- Bharti SK, Mironchik Y, Wildes F, et al. (2019). Metabolic consequences of HIF silencing in a triple negative human breast cancer xenograft. Oncotarget, 10(39), 3872-3886.
- Khandrika L, Kumar B, Koul S, Maroni P, Koul HK. (2009). Oxidative stress in prostate cancer. Cancer Letters, 282(2), 125-136.
- Yamasaki M, Nomura T, Sato F, Mimata H. (2013). Chronic hypoxia induces androgen-independent and invasive behavior in LNCaP human prostate cancer cells. Urologic Oncology, 31(7), 1124-1131.
- Bowler E, Porazinski S, Uzor S, et al. (2018). Hypoxia leads to significant changes in alternative splicing and elevated expression of CLK splice factor kinases in PC3 prostate cancer cells. BMC Cancer, 18(1), 355.
- Ma Y, Liang D, Liu J, et al. (2011). Prostate cancer cell lines under hypoxia exhibit greater stem-like properties. PLoS One, 6(12), e29170.
- Yang L, Roberts D, Takhar M, et al. (2020). Development and validation of a 28-gene hypoxia-related prognostic signature for localized prostate cancer. EBioMedicine, 57, 102884.