Exciting News for Data Enthusiasts and Bioinformatics Professionals! I am thrilled to share my latest project - a dynamic dashboard visualizing Gene Expression Data, created using R Shiny. This tool is designed to help researchers and data scientists gain insights...
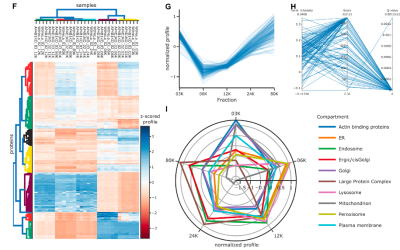
Category
Blog
A Practical Guide to Interpreting Proteomics Data Visualization
Data visualization plays a crucial role in analysis by bridging the gap between data and results. Mass spectrometry facilitates an in-depth examination of complex proteomes. Given the widespread availability of mass spectrometry, we are now faced with a vast amount of...
Luddy Journal Club
Unlocking the World of Knowledge with Luddy Journal Club! Hey, knowledge enthusiasts! I'm Swaraj, your go-to person as the Journal Committee Chair of the Biomedical Informatics Club (aka the proud President of the Luddy Journal Club). Today, let's chat about the...
Genetic and Health Record Dataset: Insights and Translations
This summary report is based on the topic Biological and translational insights from large scale genetic and electronic health record dataset by professor Dajiang Liu.
Popular Categories
No Results Found
The page you requested could not be found. Try refining your search, or use the navigation above to locate the post.