Bioinformatics data encompasses various types, each crucial for advancing our understanding of biological systems and enhancing medical research. Bioactivity data reveals how compounds interact with biological systems, essential for drug discovery and safety...
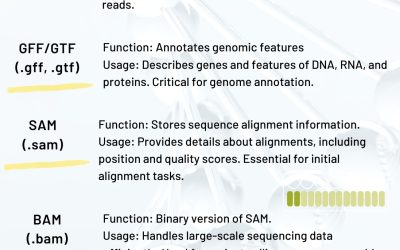
Different types of Bioinformatics data
read more